
With bitcoin priced at $69,383 at press time, the digital asset carries a $1.38 trillion market capitalization, backed by $45.37 billion in 24-hour trading volume, while its intraday swing between $67,098 and $70,434 reflects a market still regaining its footing after a steep, multi-day pullback.
Bitcoin Chart Outlook
After tumbling more than 30% from the $97,900 region to the mid-$65,000s, bitcoin is attempting to stabilize — but the higher-timeframe charts continue to reflect a market digesting heavy distribution. Volatility has cooled slightly, yet structurally, the burden of proof still sits overhead.
On the daily chart, the corrective structure remains intact. The decline from $97,939 unfolded in a waterfall sequence, culminating in a decisive Feb. 12 breakdown on volume exceeding 10,000 units — roughly double the prior average — confirming distribution. Price is now hovering near $65,000, aligning with the 38.2% Fibonacci retracement level, while resistance layers are at $70,000 and $75,000. The formation resembles a descending triangle, and bitcoin continues to close beneath critical dynamic levels. Unless $72,000 is reclaimed with expanding volume, the daily timeframe bias remains tilted lower despite intermittent stabilization attempts.
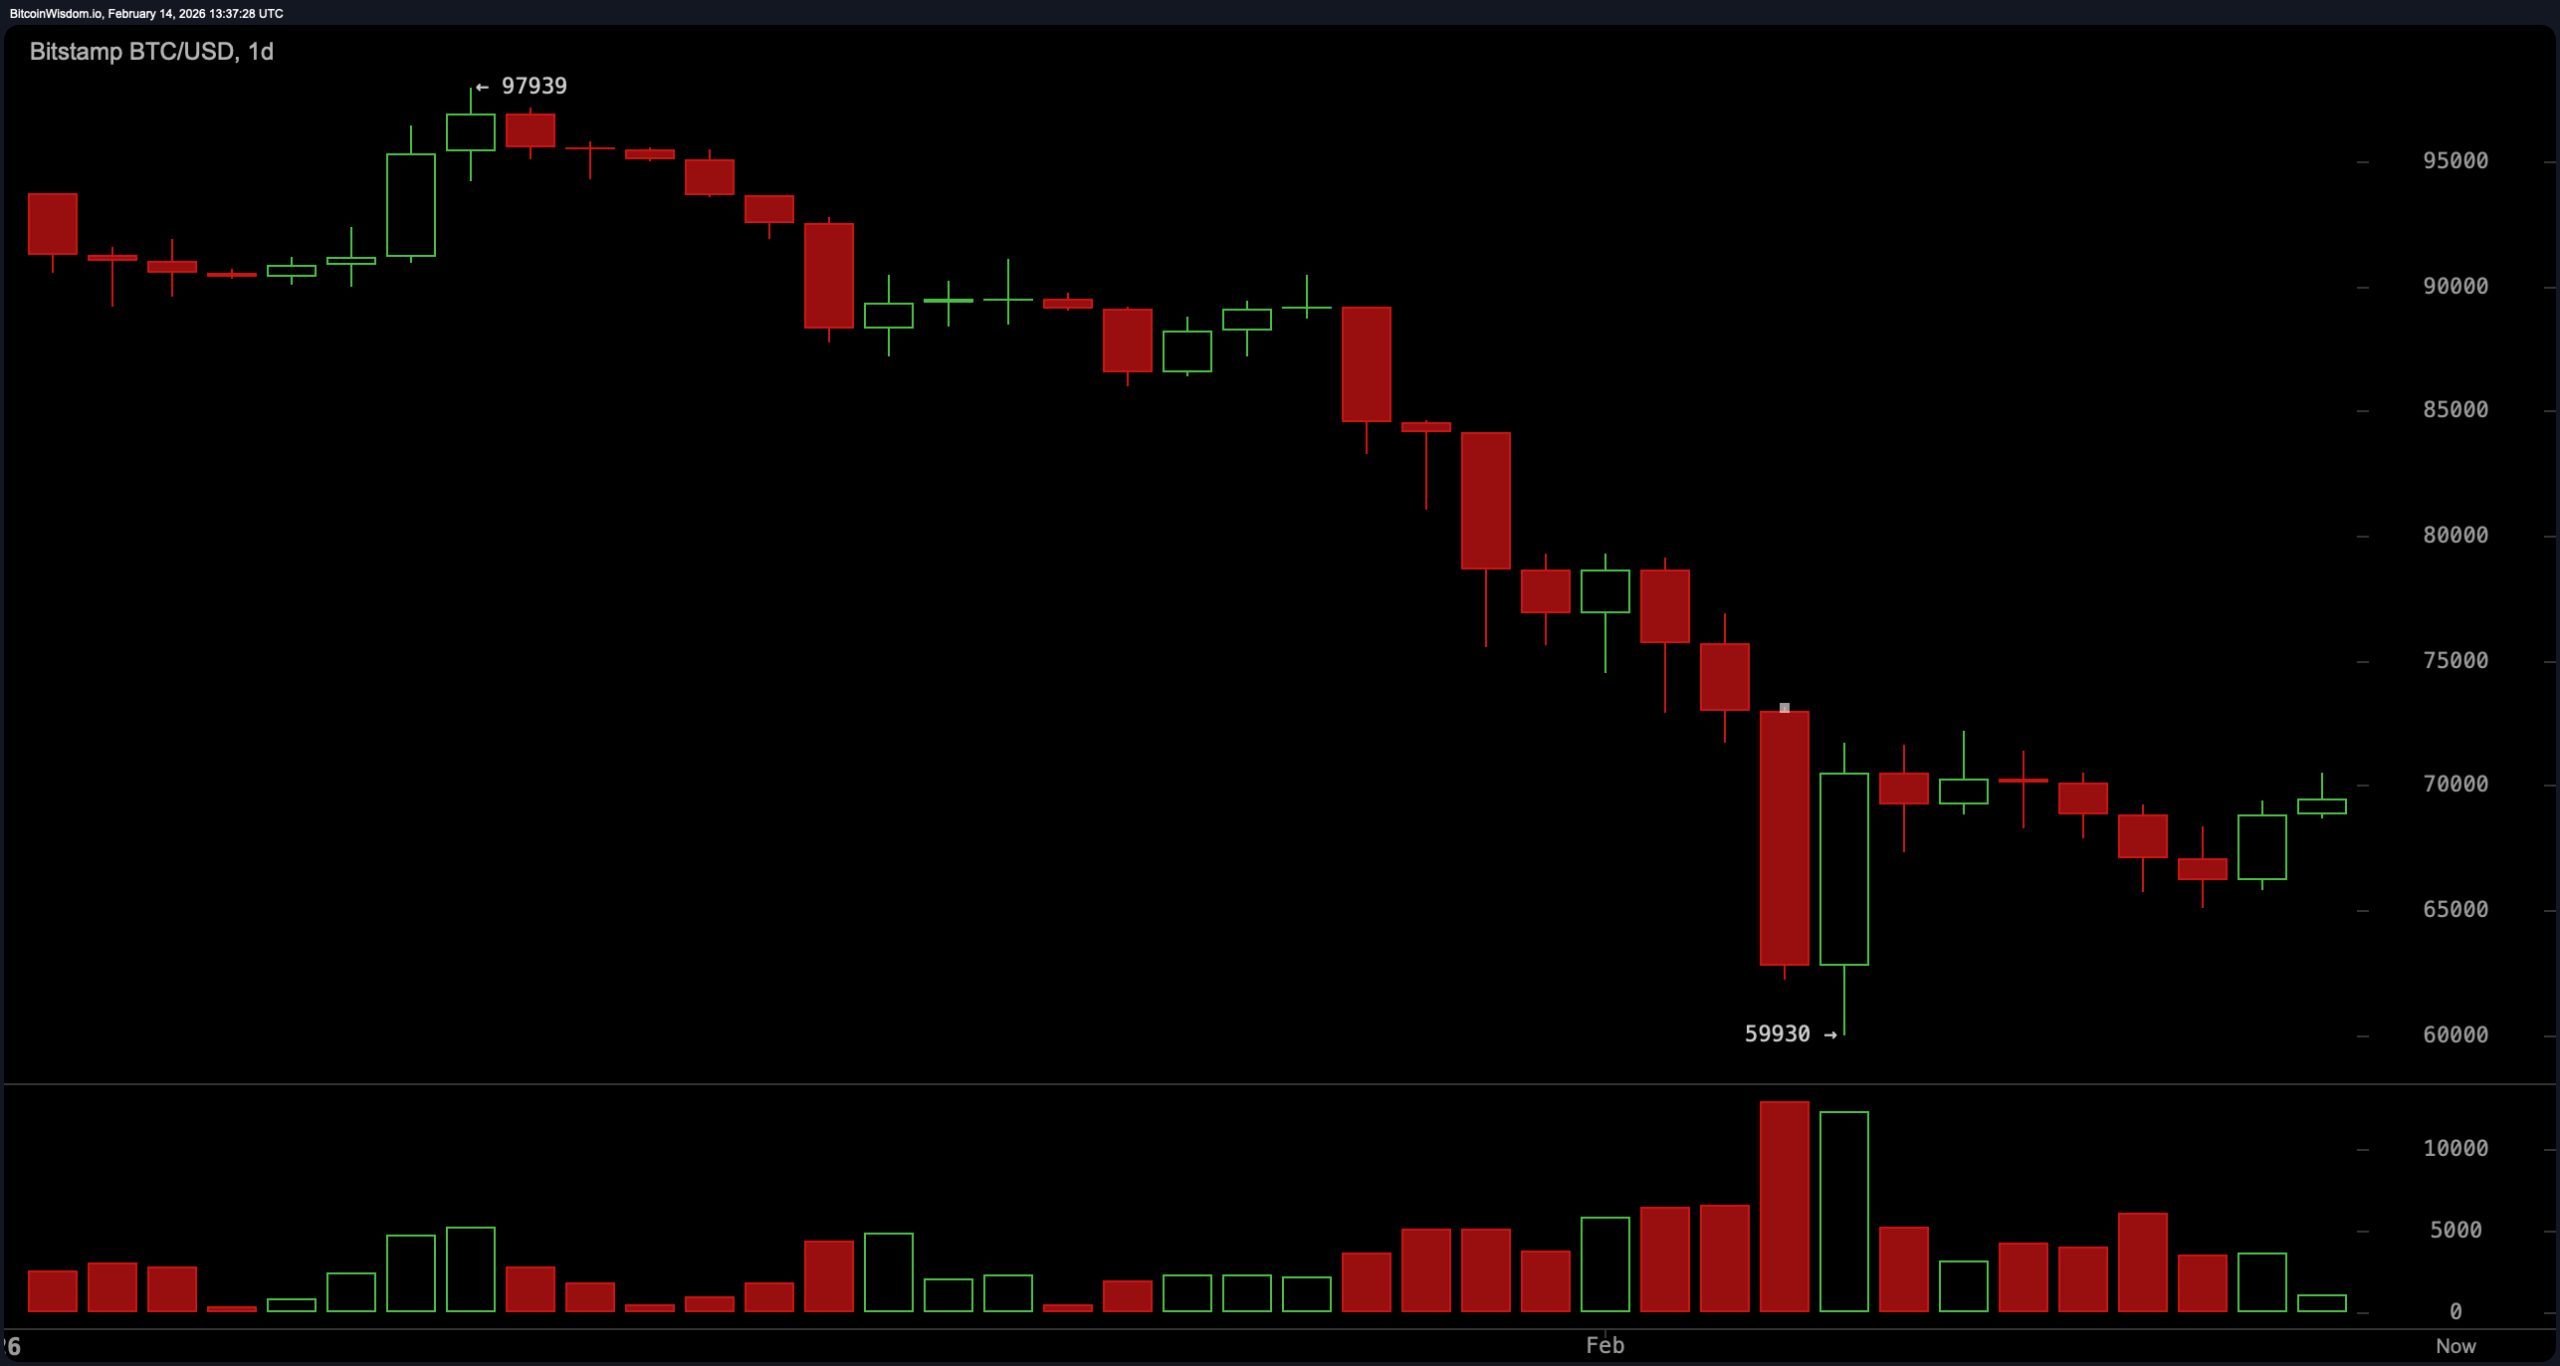
$BTC/USD 1-day chart via Bitstamp on Feb. 14, 2026.
The 4-hour chart reinforces this posture. Bitcoin declined approximately 9.5% from $72,174 to $65,800 before compressing into a tight $65,800-$66,500 range. Consecutive red marubozu candles and a shooting star near $69,500 preceded the acceleration lower. Volume expanded above 2,000 units during the Feb. 12-13 decline, well above the 800-1,200 unit norm, signaling capitulation. Subsequent rebounds have printed on sub-500 unit volume, suggesting a lack of sustained conviction. Support remains defined at $65,000-$65,800, while resistance stands at $67,000 and $70,000, with price still pressing against the lower boundary of a descending channel.
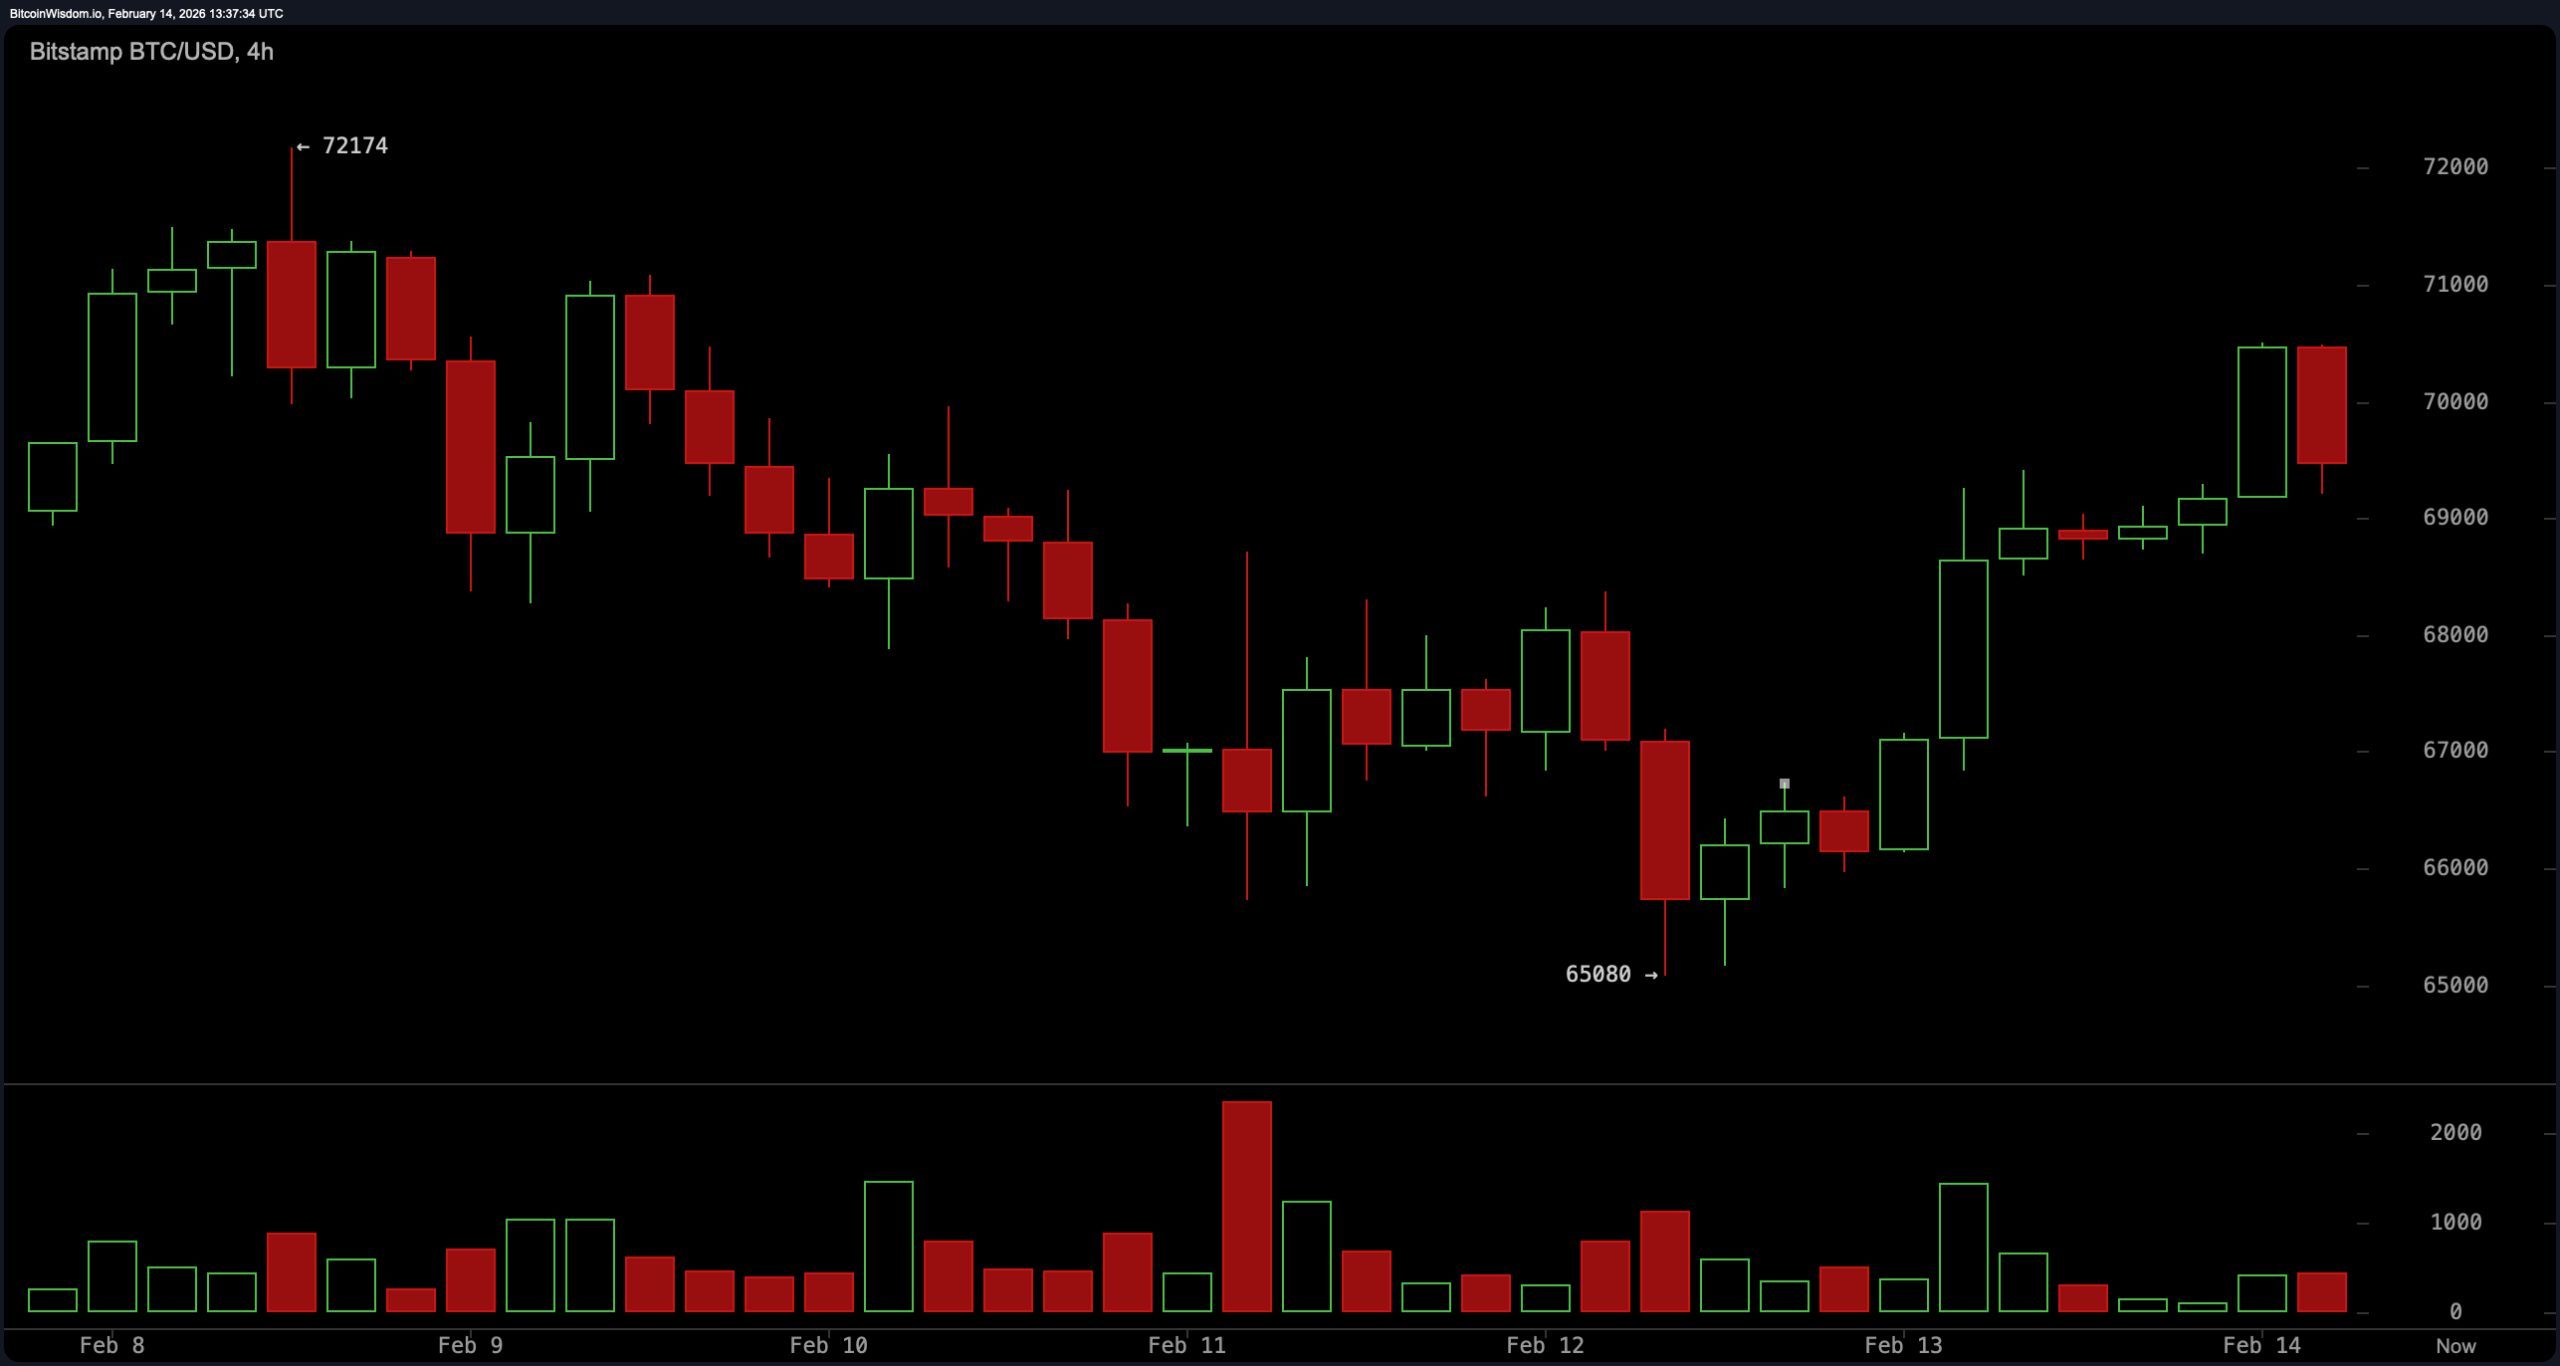
$BTC/USD 4-hour chart via Bitstamp on Feb. 14, 2026.
On the 1-hour timeframe, volatility has been pronounced but inconsistent. Bitcoin rebounded sharply from $65,628 to $70,513 before forming a double-top near $68,000 and rotating back toward $66,000. Upper wicks near $70,500 marked exhaustion, and late-session declines printed on diminishing volume below 100 units. Price remains beneath the daily volume-weighted average price (VWAP) near $67,500, and wedge compression signals an approaching directional expansion. Failed breakout attempts continue to reinforce resistance overhead, keeping short-term structure fragile.
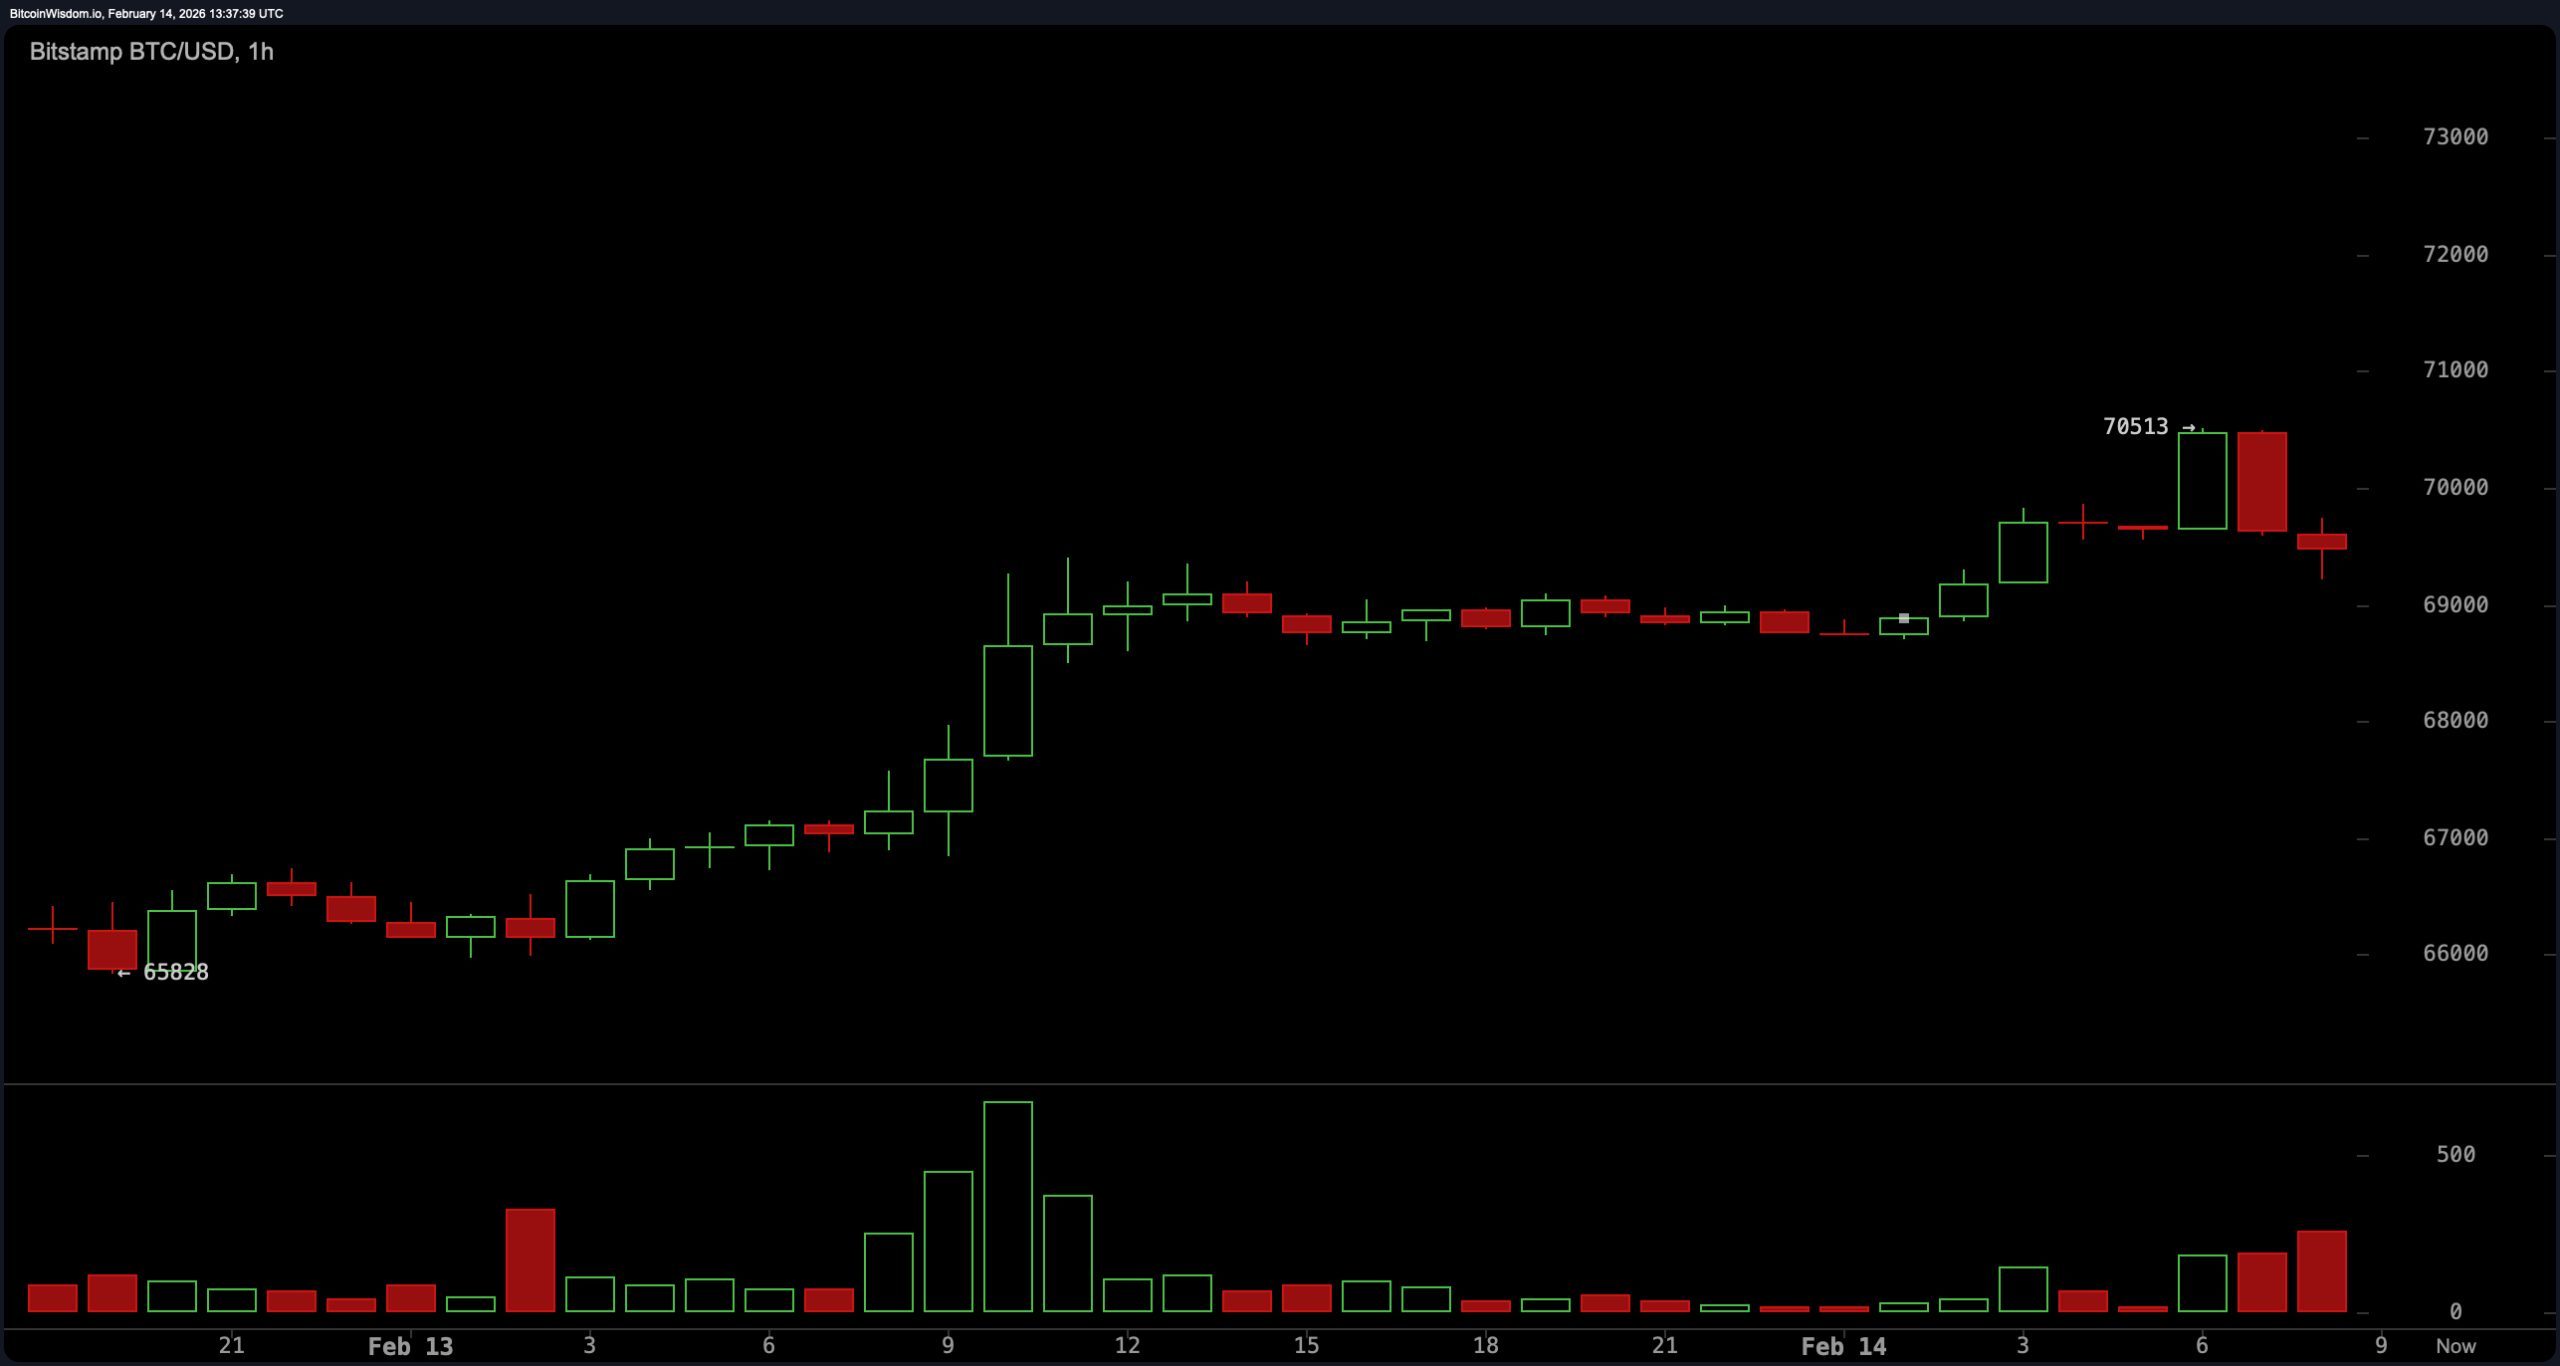
$BTC/USD 1-hour chart via Bitstamp on Feb. 14, 2026.
Oscillators reflect stabilization but stop short of confirming a reversal. The relative strength index ( RSI) at 37 is neutral, rebounding from oversold territory without strong upward expansion. The Stochastic at 37 mirrors this neutrality. The commodity channel index (CCI) at negative 54 indicates subdued momentum, while the average directional index (ADX) at 55 confirms the presence of a strong prevailing trend — notably to the downside.
The Awesome oscillator at negative 14,028 remains in negative territory, and the moving average convergence divergence ( MACD) level at negative 5,371 continues to reflect bearish momentum. Momentum at negative 3,555 suggests short-term upward pressure, pointing to possible relief within the broader corrective framework.
Moving averages (MAs) remain stacked in bearish alignment. The exponential moving average (EMA) and simple moving average (SMA) structures show price trading beneath nearly every major trend gauge. The EMA (10-day) sits at $70,055, while the SMA (10-day) rests at $68,326. The EMA (20) stands at $74,185, and the SMA (20) at $75,066. The EMA (30) is positioned at $77,404, and the SMA (30) at $80,348.
The EMA (50) reads $81,619, with the SMA (50) at $84,613. Longer-term markers remain elevated, including the EMA (100) at $88,191 and the SMA (100) at $88,023, followed by the EMA (200) at $94,360 and the SMA (200) at $100,806. In practical terms, bitcoin remains beneath short-, intermediate-, and long-term averages — a configuration that continues to cap rallies and reinforce structural overhead pressure.
Bull Verdict:
If $65,000-$65,800 continues to hold and price reclaims $67,000 with expanding volume, short-term momentum could build toward $70,000 and potentially challenge $72,000. Oversold recovery signals across shorter timeframes and contracting downside volume suggest that a relief rally remains technically plausible.
Bear Verdict:
As long as bitcoin trades below $70,000 and remains under the majority of key moving averages, the broader corrective trend remains dominant. A decisive break below $65,000 would expose downside risk toward $60,000, keeping the structural bias firmly in favor of continuation rather than reversal.
FAQ ❓
- What is bitcoin’s price on Feb. 14, 2026? Bitcoin is trading at $69,383 with a 24-hour range between $67,098 and $70,434.
- Is bitcoin in a bullish or bearish trend right now? Bitcoin remains in a short-term corrective trend below key resistance levels and major moving averages.
- What are the key support and resistance levels for bitcoin? Immediate support sits at $65,000-$65,800, while resistance is layered at $67,000, $70,000 and $75,000.
- What do bitcoin’s technical indicators signal? Oscillators show neutral-to- bearish momentum, with the moving average convergence divergence ( MACD) and multiple exponential moving averages indicating continued downside pressure.


 Bitcoin
  Ethereum
  Tether
  USDC
USDC  Dogecoin
  Bitcoin Cash
  Cardano
  LEO Token
  Stellar
  Zcash
Zcash  Hedera
  Litecoin
  Tether Gold
  OKB
OKB  Gate
Gate  KuCoin
  Cosmos Hub
  Algorand
  VeChain
  TrueUSD
  Decred
  IOTA
IOTA  NEO
NEO  Basic Attention
  Ravencoin
  Synthetix
  0x Protocol
  DigiByte
  Nano
Nano  Siacoin
  Numeraire
  Waves
Waves  Pax Dollar
  Status
  Ontology
  Enjin Coin
  BUSD
BUSD  Steem
Steem  OMG Network
  Augur
Augur